In large pieces of malware it is difficult, when under time pressure to fully reverse it. So, many times you just put a breakpoint on the imported functions like say send() for outbound TCP connections. Then you run the malware.
What happens now, is that the BP will be hit when the malware tries to send traffic. And that's fine. But where was it called from? As in, which function actually made the call to send()? This is important because it'll help you go back and then find out how the payload was constructed, how the C&C was decided... and many other things.
There's 2 ways to do this. One, you can identify all the references made to the send() call by the binary, and set breakpoints on all of them. Then when one gets hit you can inspect it further. This is the most obvious way to do it.
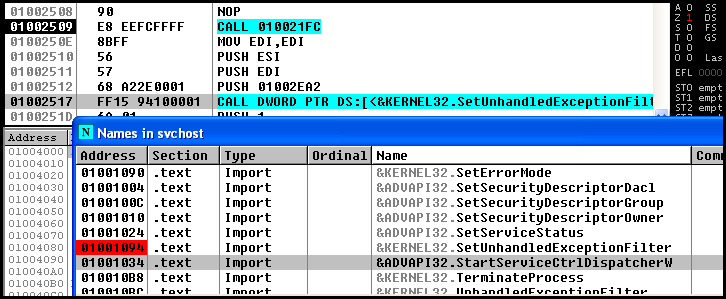
The other way is to first, as usual set a breakpoint on the function you want to trace. Here I just choose SetUnhandledExceptionFilter() as that's the first function I can see :). The address immediately after that is 0100251D - make a note of that.
Then, instead of searching through the 123 references to the call and trying to guess which one is useful, look at where the function is returning to when the breakpoint is hit. This can be found on the Olly call stack. Many times you have to step through a lot of system function code, but eventually, it will return to user code. I tend to use the Ctrl+F9 while in system code, and keep watching the call stack for when the address changes to one where the code is running from.

Then I visit that address, set a breakpoint and hit F9 again. This time I will break inside the exact place where the call was made from. Note the address? :)
Then we go to that address and set a breakpoint and run...and we'll break in the exact place where the call was made.

What happens now, is that the BP will be hit when the malware tries to send traffic. And that's fine. But where was it called from? As in, which function actually made the call to send()? This is important because it'll help you go back and then find out how the payload was constructed, how the C&C was decided... and many other things.
There's 2 ways to do this. One, you can identify all the references made to the send() call by the binary, and set breakpoints on all of them. Then when one gets hit you can inspect it further. This is the most obvious way to do it.
The other way is to first, as usual set a breakpoint on the function you want to trace. Here I just choose SetUnhandledExceptionFilter() as that's the first function I can see :). The address immediately after that is 0100251D - make a note of that.
Then, instead of searching through the 123 references to the call and trying to guess which one is useful, look at where the function is returning to when the breakpoint is hit. This can be found on the Olly call stack. Many times you have to step through a lot of system function code, but eventually, it will return to user code. I tend to use the Ctrl+F9 while in system code, and keep watching the call stack for when the address changes to one where the code is running from.
Then I visit that address, set a breakpoint and hit F9 again. This time I will break inside the exact place where the call was made from. Note the address? :)
Then we go to that address and set a breakpoint and run...and we'll break in the exact place where the call was made.
No comments:
Post a Comment